Explore and understand the world with Worlddataview
At Worlddataview.com, we believe that data and information should be accessible to all, for the benefit of everyone. We collect high-quality and up-to-date data from reliable data providers, data publishers and organizations and we publish them under various visualizations and we encourage the public access of the data to as many people as possible. The data are organized in Topics under collections of indicators and are accessible through maps, charts, tables, videos and human and machine -readable files.
We cover a large range of topics which describe the life of the people and the states of the country where they live at a statistical point of view. You may access each of the topics and their collections of indicators by clicking the links in the small boxes below, or by using the left-side menu.
Explore data from different topics
Economy
Balance of payments, Growth and economic structure, Income and savings, Labor and productivity, Prices and terms of trade
Poverty and inequality
Distribution of income or consumption, Poverty rates at international poverty lines, Poverty rates at national poverty lines
Environment
Agriculture, Climate, Energy & mining, Environment, Urban and rural development, Water and sanitation
States and Markets
Business environment, Financial access and stability, Government finance and taxes, Infrastructure and communications, Military, Science and innovation, Stock markets
Interactive visual representations
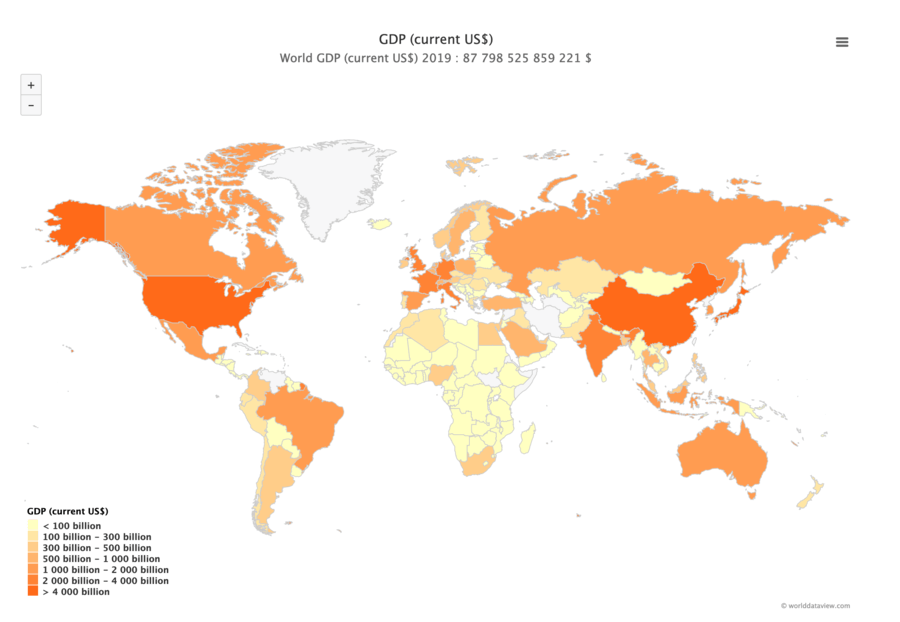
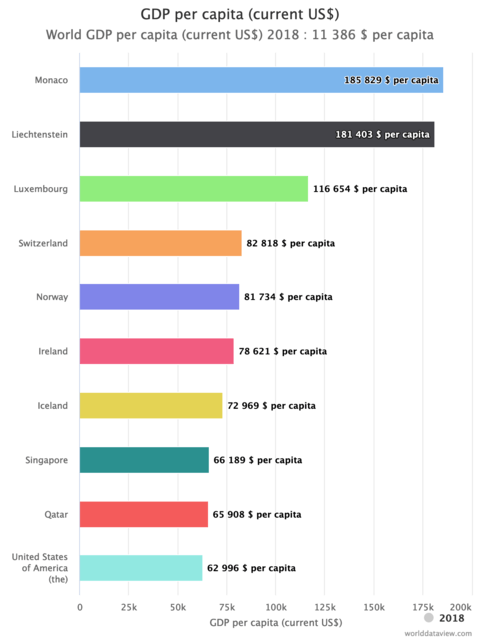
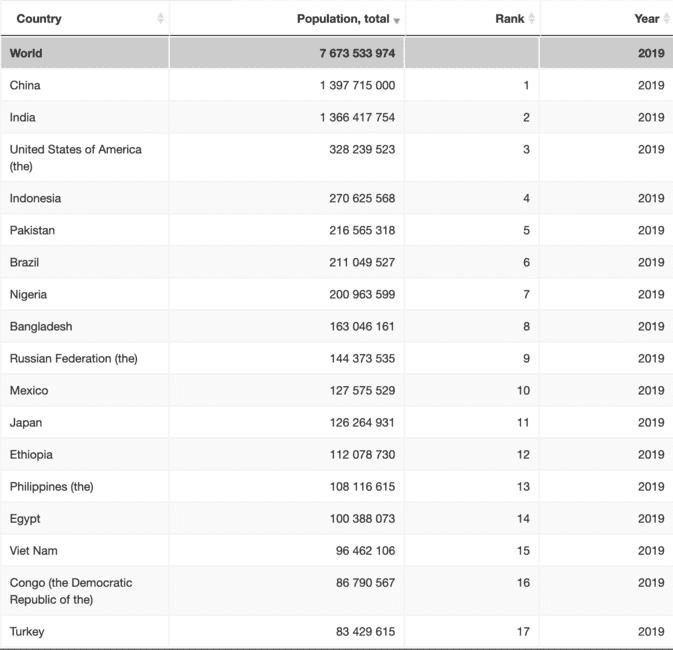
maps, charts, tables, timelines
Worlddataview.com provides fast access to awesome interactive visual representations : maps, charts, tables, timelines, videos (coming soon) and human and machine -readable files.
You are invited to share our visualizations and to include them in your work to benefit yourself and others if you like them. Please just remember to cite Worlddataview.com as your sources as explain in the Terms and Conditions, Licenses.
You can export or print the maps, charts, tables in files such as images (PNG, JPEG, SVG) or data files (CSV, EXCEL), view the maps in full screen and easily copy data from the tables to your clipboard, by using the contextual menu of each of the visualizations.
Maps can be zoomed with the zoom buttons or by clicking one specific country and be navigated by dragging it, and more details are shown for a specific country by hovering over it.
The timeline can be use to progress in the time range and also be reset from the start.
High quality, reliable and up-to-date sources of data
We collect high quality and up-to-date data from various data providers, data publishers and organizations at various stage (world and regional stages) and from various status (public entities, private organizations, NGOs, etc.) that we think are reliable such as the World Bank Group (https://www.worldbank.org/). We do not produce the data, we provide them to you as it is at the sources. We always cite the sources we use, you may find them in the bottom of each indicator page.
Each indicator covers a range of years and countries and territories depending on the availibity of the data from the data sources. When in an indicator, some data are missing from the main data source, we reserve the right to add data from other sources, with respect to coherence of the whole dataset. In such cases, we will always inform you by providing all the data sources we use for each indicator.
The maps displayed on the Worlddataview.com are for reference only. The boundaries, colors, denominations and any other information shown on these maps do not imply, on the part of the Worlddataview.com, any judgment on the legal status of any territory, or any endorsement or acceptance of such boundaries.